How to Use the
Property Decision Matrix
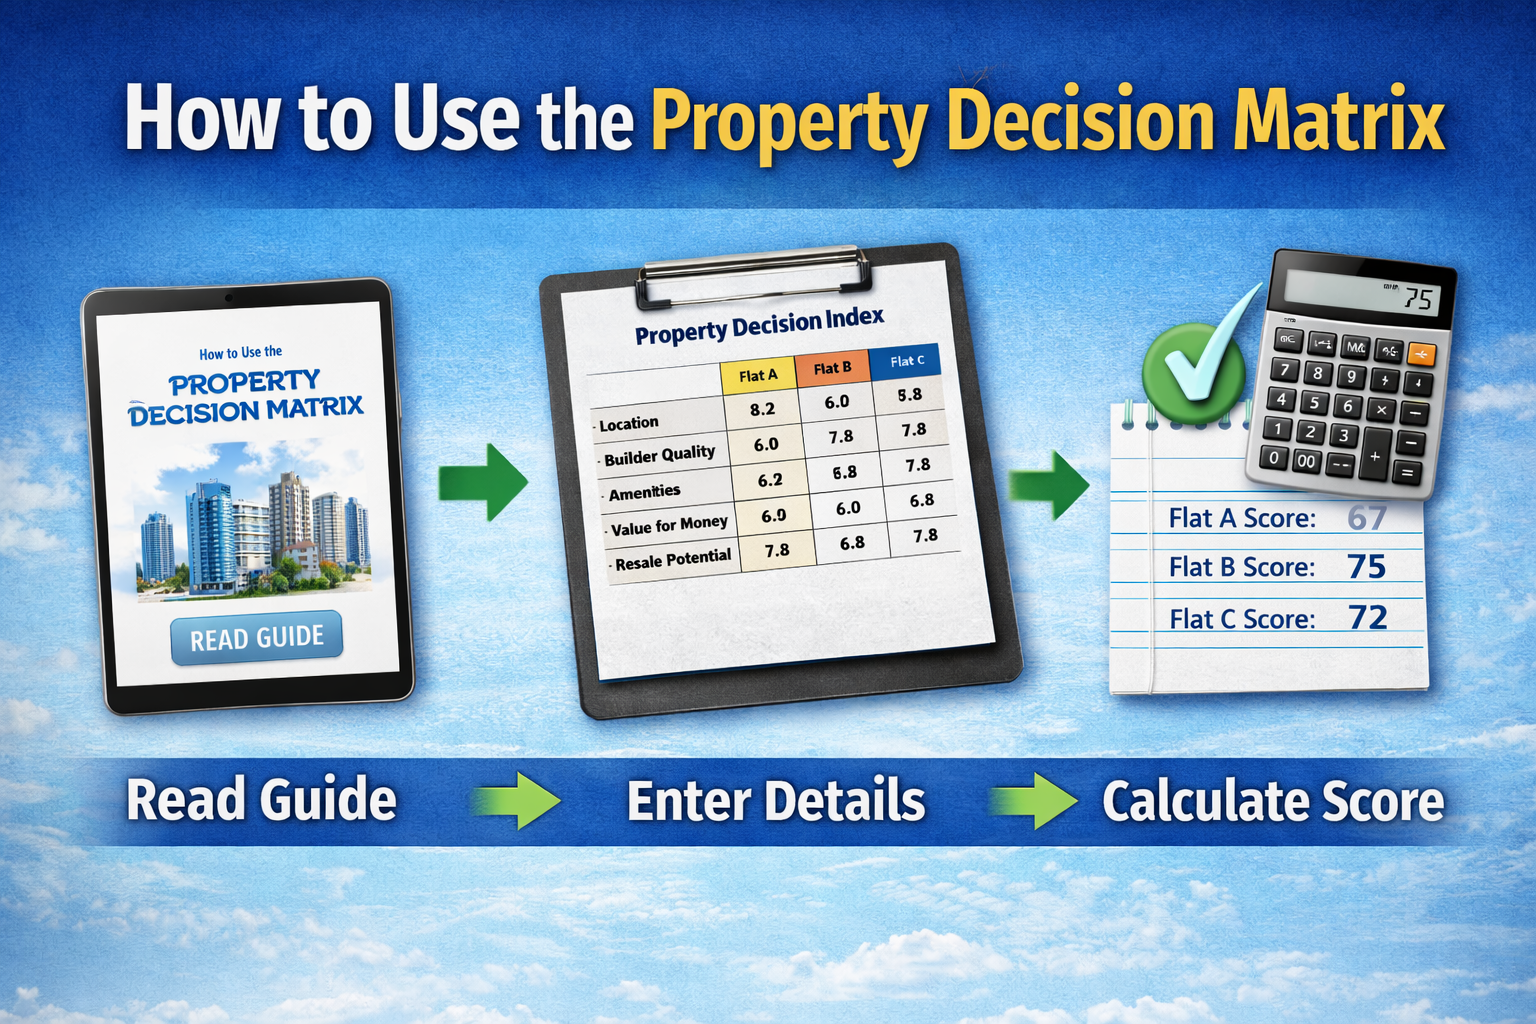
A step-by-step guide to scoring your shortlisted flats objectively — so the best asset becomes mathematically obvious, not emotionally chosen.
What is this tool?
The Asset Supremacy Scoring Model is a McKinsey-style weighted decision matrix built for home buyers. It was designed using the Bulletproof Problem Solving framework — the same structured approach used by management consultants to make high-stakes capital decisions.
Most buyers compare flats by feel — which one looks nicer, which sales executive was friendlier, or which had a better sample flat. This tool replaces that emotional process with a data-driven score.
80% of a property’s long-term value comes from just three factors: location, price efficiency, and developer credibility. This matrix makes sure those factors dominate your decision — not the clubhouse or interior design.
Final score is expressed out of 100
How to use the tool — step by step
The entire process takes about 10–15 minutes if you have your flat details ready. Here is the exact sequence to follow.
Select End Use if you are buying to live in the flat. Select Investment if you are buying to rent out or sell later for appreciation. This changes the weights assigned to each pillar automatically.
Enter a recognisable name for each flat in the text fields — for example “Kharghar 2BHK” or “Lodha Palava”. This helps you track which score belongs to which property.
Before touching the sliders, gather real numbers for each flat: price per sqft (total price ÷ saleable area), carpet area, distance from the nearest metro or railway station, and the developer’s RERA record. Do not score from memory — use actual data.
For each of the 5 pillars, click “view rubric” to see the exact definition of each score from 1 to 5. Move the slider to match your flat’s data to the rubric definition. Score all three flats on each pillar before moving to the next.
The scores calculate live. The flat with the highest score out of 100 is the strongest asset. Check the breakdown table to understand exactly which pillars each flat won or lost — and by how much.
The score tells you which flat is objectively superior across the factors that matter most. If you feel strongly about overriding it, the breakdown will tell you exactly which factor you are choosing to accept as a trade-off — and that is a much more honest decision.
Price per sqft of each flat (total price ÷ saleable area) · Carpet area from the RERA certificate · Distance from the nearest metro, railway, or highway · Developer name and their RERA project history · Average price per sqft of 3–5 comparable nearby projects (for financial viability scoring)
Understanding the 5 evaluation pillars
The model uses five MECE pillars — Mutually Exclusive and Collectively Exhaustive. They do not overlap, and together they cover every meaningful dimension of a property purchase decision.
For end use buyers, Asset Quality (usability and comfort) carries the highest weight because you live there every day. For investment buyers, Financial Viability and Locational Alpha dominate because those drive rental yield and capital appreciation — not how pretty the bathroom tiles are.
The scoring rubric explained
Every pillar is scored from 1 (poor) to 5 (excellent). The rubric below shows the exact definition for each score. You can also click “view rubric” inside the tool for a quick reference.
Financial viability — how to score
First calculate the price per sqft of each flat. Then compare to the average price/sqft of 5 nearby comparable projects (use MagicBricks, 99acres, or NoBroker).
| Score | Meaning | What it looks like |
|---|---|---|
| 1★☆☆☆☆ | Very overpriced | Price/sqft is 15–20% or more above the market average |
| 2★★☆☆☆ | Overpriced | 10–15% above market — premium not justified by features |
| 3★★★☆☆ | Fair market price | Within ±5% of the average comparable price/sqft |
| 4★★★★☆ | Below market | 5–10% cheaper than comparable projects — good value |
| 5★★★★★ | Excellent deal | ≥10% below market — significantly underpriced asset |
Asset quality — how to score
Calculate: Carpet Area ÷ Saleable Area × 100 = Efficiency %. The carpet area is on the RERA certificate. Saleable area is the number on the brochure.
| Score | Efficiency | What it means |
|---|---|---|
| 1★☆☆☆☆ | < 60% | Over 40% of what you pay for is unusable common area. Avoid. |
| 2★★☆☆☆ | 60–65% | Below average. Expect cramped rooms despite large-sounding sqft |
| 3★★★☆☆ | 65–70% | Industry average. Decent but not exceptional |
| 4★★★★☆ | 70–75% | Good efficiency. Most of the area translates to usable rooms |
| 5★★★★★ | > 75% | Excellent. Compact, efficient layout. Every sqft counts. |
Locational alpha — how to score
Measure actual distance using Google Maps from the flat to the nearest metro station, railway station, or major highway — whichever is most relevant for that city or corridor.
| Score | Distance | What it means |
|---|---|---|
| 1★☆☆☆☆ | > 10 km | Isolated location. Very high commute friction. Poor appreciation. |
| 2★★☆☆☆ | 5–10 km | Requires a vehicle every day. Moderate connectivity. |
| 3★★★☆☆ | 3–5 km | Acceptable. An auto or short drive to transport. |
| 4★★★★☆ | < 3 km | Good connectivity. Easy daily commute. |
| 5★★★★★ | < 1 km (walk) | Walking distance. Premium location. Strongest appreciation driver. |
Developer risk — how to score
Search the developer’s name on RERA Maharashtra (or your state’s RERA portal) and check: number of registered projects, complaints filed, and whether past projects were delivered on time.
| Score | Developer type | What to look for |
|---|---|---|
| 1★☆☆☆☆ | Unknown builder | First project, no track record, multiple RERA complaints |
| 2★★☆☆☆ | Small builder | Has delivered 1–2 projects but with delays or quality issues |
| 3★★★☆☆ | Local builder | Average delivery record, no major complaints, 3–5 projects done |
| 4★★★★☆ | Regional developer | Known brand in the city, mostly on-time deliveries, good reputation |
| 5★★★★★ | Tier-1 / Listed | National brand, BSE/NSE listed, zero or minimal delay history |
Future liquidity — how to score
Look at how active that micro-market is. Search for recent transactions on 99acres or MagicBricks, check rental listings count, and see if the area has population/infrastructure growth planned.
| Score | Market type | Signs to look for |
|---|---|---|
| 1★☆☆☆☆ | Dead market | Very few transactions, high unsold inventory, no rental demand |
| 2★★☆☆☆ | Slow market | Takes 12+ months to sell, moderate rental interest |
| 3★★★☆☆ | Average market | 6–12 month typical resale time, decent rental market |
| 4★★★★☆ | Active market | High transaction volume, strong rental demand, infrastructure growth |
| 5★★★★★ | Prime market | Sub-6-month resale, high rental yield, consistently appreciating node |
A worked example
Here is how a buyer in Navi Mumbai would use the matrix to compare two flats — both priced at ₹1 crore.
| Metric | Flat A — Kharghar | Flat B — Taloja |
|---|---|---|
| Total price | ₹1,00,00,000 | ₹1,00,00,000 |
| Saleable area | 1,100 sqft | 1,200 sqft |
| Carpet area (RERA) | 780 sqft | 700 sqft |
| Price per sqft | ₹9,090/sqft | ₹8,333/sqft |
| Carpet efficiency | 71% | 58% |
| Metro distance | 1.2 km | 6 km |
| Developer | Tier-1 listed | Local builder |
| Market avg. price/sqft | ₹9,500/sqft (nearby projects) | |
Flat B looks attractive: cheaper per sqft and larger on paper (1,200 sqft vs 1,100 sqft). But look at the carpet area — 700 sqft vs 780 sqft. You are actually getting less usable space for the same money. The extra 100 sqft is corridors, walls, and lift lobby that you paid for but cannot use.
After scoring both flats on all 5 pillars (using the rubrics above) and applying the End Use weights:
| Pillar | Weight | Flat A score | Flat B score |
|---|---|---|---|
| Financial viability | 25% | 3 → 0.75 | 4 → 1.00 |
| Asset quality | 30% | 4 → 1.20 | 1 → 0.30 |
| Locational alpha | 25% | 5 → 1.25 | 2 → 0.50 |
| Developer risk | 10% | 5 → 0.50 | 2 → 0.20 |
| Future liquidity | 10% | 4 → 0.40 | 3 → 0.30 |
| Asset Supremacy Score | 100% | 82 / 100 | 46 / 100 |
Flat A wins decisively at 82 vs 46 — not because it is cheaper (it is actually slightly more expensive per sqft), but because it gives more usable space, is walkable to the metro, and is backed by a Tier-1 developer. Flat B’s slightly lower price is more than offset by its structural weaknesses.
6 emotional biases this model eliminates
These are the most common reasons buyers regret their purchase 3–5 years later. The scoring model is specifically designed to neutralise each one.
Frequently asked questions
Ready to score your shortlisted flats?
Collect your property data and let the matrix do the analysis — objectively.
Use the scoring tool ↗